
| What are spatial datasets? |
Geospatial data (also known as “spatial data”) is used to describe data that represents features or objects on the Earth’s surface, whether it’s man-made or natural, if it has to do with a specific location on the globe. Spatial data can exist in a variety of formats and contains more than just location specific information.
| Spatial models |
Spatial modeling or feature representation, is an analytical process conducted in conjunction with a geographical information system (GIS) in order to describe basic processes and properties for a given set of spatial features. The objective of spatial modeling is to be able to study and simulate spatial objects or phenomena that occur in the real world and facilitate problem solving and planning [source].
| Vectors |
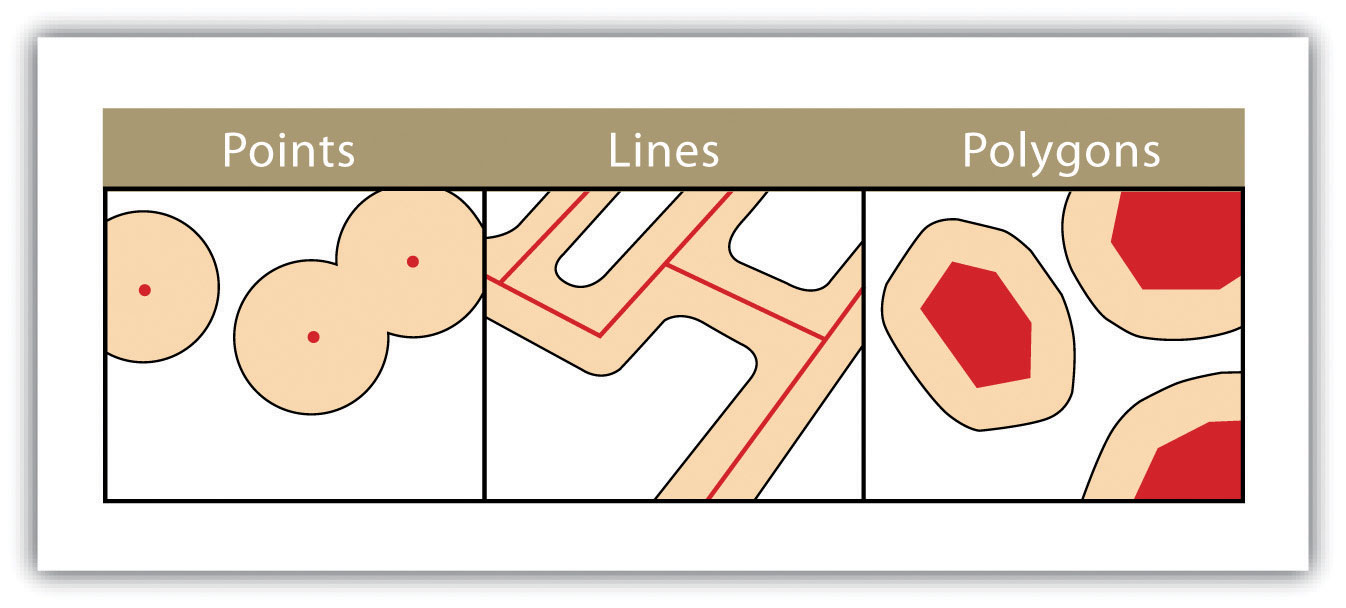
Vectors are graphical representations of the real world. There are three main types of vector data: points, lines and polygons. The points help create lines, and the connecting lines form enclosed areas or polygons. Vectors often represent the generalization of features or objects on the planet's surface. Vector data is usually stored in shapefiles, sometimes referred to as .shp files.

| Rasters |
Raster represents information presented in a pixel grid. Each pixel stored within a raster has value. This can be anything from a unit of measurement, color or information about a specific element. Typically, raster refers to imagery, but in spatial analysis it frequently refers to an orthoimage or the photos taken from aerial devices or satellites.

| Attribute table |
Whenever spatial data contains additional information or non-spatial data, it is called an attribute. Spatial data can have any number of attributes about a location. For example, this may be a map, photographs, historical information or anything else that may be deemed necessary.

| Import your data |
In some case you may want to plot on a map, data that is in a table or an Excel spreadsheet. This case warrants you to have a list of latitude and longitude (X, Y) coordinates so that you can easily import this data in your GIS platform.
Importing your data using ESRI ArcGIS
Read more here
Importing your data using QGIS
Joining spatial features to your data
You might obtain data that is stored in a table format, such as a dBASE, excel or csv. This data can be associated geographic features and display the data on your map. Typically, you'll join the tabular data to a pre-existing spatial layer based on the value of a field that can be found in both the non-spatial data and the attribute table of the spatial layer respectively. The name of the field does not have to be the same, but the data type has to be the same; you join numbers to numbers, strings to strings etc.
Joining spatial features to your data using ESRI ArcGIS
Joining spatial features to your data using QGIS
